
Financial Snapshot — FY2025 Actuals
| Metric | FY2025 |
|---|---|
| Total Revenue | $B |
| Subscription & Services Revenue | $B ( of total) |
| Adjusted EBITDA | $M |
| Adjusted EBITDA Margin | |
| Adjusted EPS | $ |
| GAAP Net Income / (Loss) — Q4 2025 | ($M) |
| Cash & Cash Equivalents | $B |
| Buybacks Executed | $B |
| Assets on Platform (Q3 2025) | $B |
| Monthly Transacting Users | M |
| Total Trading Volume | $T ( YoY) |
Adjusted EBITDA of $M is Coinbase’s company-reported figure, which adds back all non-cash and non-recurring items including crypto mark-to-market, investment gains/losses, and restructuring charges. My model uses a narrower definition (GAAP EBIT + SBC + acquisition-related amortization + D&A) that produces $M. The difference is entirely definitional — the operating inputs are identical.
Note: The Q4 2025 GAAP net loss is driven almost entirely by non-cash ASC 350-60 fair-value accounting on the crypto portfolio and Circle equity stake — not operating deterioration. Adjusted metrics are the economically meaningful read. Full explanation in later.
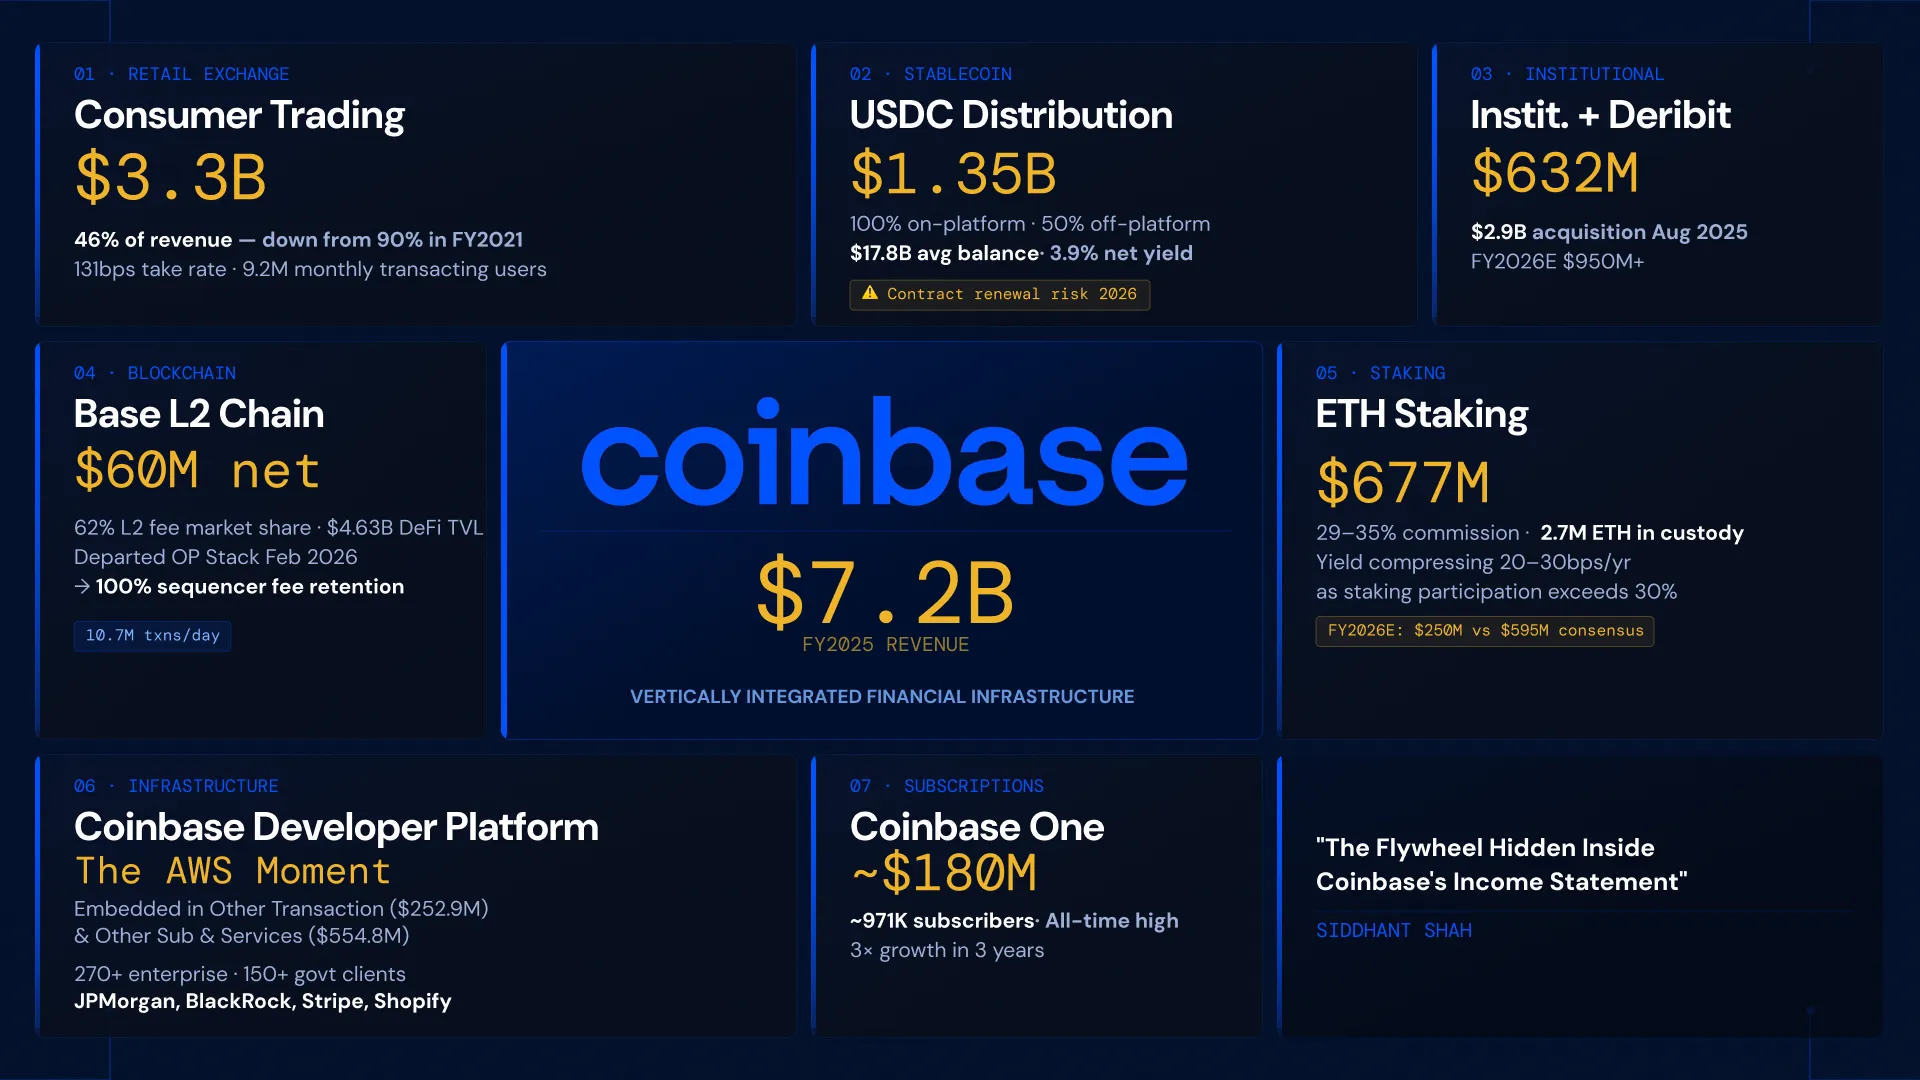
USDC — The $1.35 Billion Revenue Stream Coinbase Does Not Operate
FY2025 Revenue: $1,348.8M | % of Total: 18.8% | YoY Growth: +48%
Coinbase does not issue USDC, does not hold its reserves, and does not set its yield. What Coinbase holds is a revenue-sharing agreement — confirmed in Circle’s S-1 — entitling it to of reserve interest on USDC balances held on-platform and on USDC held off-platform. At an average on-platform balance of $B in FY2025 and an approx. effective net yield to Coinbase (after the on-platform/off-platform sharing split), that contract produced $M — the single largest recurring revenue line in the business, growing year-over-year on balance growth rather than rate movement.
The agreement renews in 2026. Circle completed its IPO in June 2025 (ticker: CRCL) — meaning its public shareholders can now see exactly what it pays Coinbase — and Circle has already paid Binance $M upfront plus monthly distribution fees to carry USDC. That deal is the market precedent. A shift to sharing terms removes $-M from Coinbase’s FY2026 P&L depending on the rate path — $M at the modeled Fed Funds Rate.
The USDC Scenarios tab in my model maps the full matrix of sharing-rate and rate-path outcomes — a $M spread across nine cells on a single revenue line.
Primary risk: USDC renewal terms. Secondary risk: Fed rate sensitivity.
Base Chain — 30x Growth, Zero Consensus Coverage
FY2025 Gross Sequencer Revenue: $75.4M | YoY Growth: approx. 30x | L2 Fee Market Share: 62%
Base generated $M in gross sequencer revenue in FY2025 — 30x year-over-year — while commanding 46% of total L2 DeFi TVL at $B and 62% of the L2 fee market by revenue. As of February 2026, it processes approx. million transactions per day at roughly $ in daily fees.
Most models I’ve come across bury the entire Base revenue stream inside “Other Transaction” with no sub-breakout and no forward estimate for sequencer economics specifically. Here’s what makes the gap more significant than it looks: on February 18, 2026, Coinbase announced Base is departing the OP Stack, eliminating the approx. Optimism Protocol revenue share beginning Q2 2026. Coinbase now retains of sequencer fees. That event has not been incorporated into consensus models I’ve reviewed.
Primary risk: DeFi activity cyclicality. Upside catalyst: CDP enterprise client growth driving Base transaction volume.
Deribit — Transforming the Institutional Revenue Profile
FY2025 Partial-Year Contribution: approx. $152M | Q4 2025 Institutional Revenue: $185M (+37% QoQ) | Acquisition Price: $2.9B
On August 14, 2025, Coinbase closed Deribit — the world’s largest crypto derivatives exchange by open interest — for $B ($M cash plus approx. million shares). The partial-year contribution was approx. $M and was the primary driver of the YoY growth in institutional transaction revenue. Q4 2025 institutional revenue hit $M, up sequentially.
FY2026 is the first full year. At the $-M monthly run-rate implied by Q4 2025, annualized Deribit revenue alone approaches $-M — roughly x forward institutional revenue on the acquisition price, defensible given the franchise position. The GAAP cost is real: the Deribit PPA Schedule tab estimates approx. $M in annual amortization beginning FY2026, a $M step-up from the partial-year FY2025 figure of $M.
CME Group’s 24/7 crypto futures and options launch on May 29, 2026 is the first credible institutional competitor to materialize since the acquisition closed. The consensus FY2026E for institutional revenue of $M (+45% YoY) carries no adjustment for it. My model estimates $M for FY2026E institutional transaction revenue, inclusive of a $M first-full-year Deribit contribution — materially above consensus.
Primary risk: CME competitive entry in H2 2026 and PPA amortization drag on GAAP EBIT. Strategic case intact on medium-term horizon.
Ethereum Staking — A Math Problem Disguised as a Growth Story
FY2025 Revenue: $677.4M | Q4 2025: $152M (-18% QoQ) | Consensus FY2026E: $595.2M (-12% YoY) | Model FY2026E: $249.8M (-63% YoY)
Coinbase earns a commission of approx. - on gross ETH staking rewards — high-margin, recurring, zero customer acquisition cost. In FY2025 that produced $M. The problem is that the same mechanics that made this a growth driver in 2023-2024 are now working in reverse.
ETH staking participation has crossed 30% of total supply, with M+ ETH staked. Block rewards are fixed in aggregate — divided across a growing validator set, per-validator yields decline. From approx. APY in early 2024 to - APY by early 2026, with approx. - basis points of further annual compression expected. Q4 2025 staking revenue was $M, down sequentially, in a quarter where ETH prices were relatively stable — consistent with yield compression driving the decline rather than price movement alone.
The consensus FY2026E of $M is in the right direction but it requires ETH prices to hold roughly flat to materialize.
My model estimates $M — substantially below consensus — driven by formula: M ETH in custody x $ average ETH price x net user yield. The gap versus consensus reflects the compounding effect of yield compression applied to the full balance, which most consensus estimates do not fully capture.
Primary risk: ETH price appreciation required to offset structural yield dilution.
Digital Asset Portfolio & ASC 350-60 — The Accounting Story Behind the $667M Loss
Q4 2025 GAAP Net Loss: ($667M) | Unrealized Crypto Loss: $718M | Adjusted EBITDA Margin: 44.4%
Coinbase reported a ($M) GAAP net loss in Q4 2025. The cause: $M in unrealized losses on its corporate crypto portfolio and $M in fair-value markdown on its Circle equity stake, both flowing through net income under ASC 350-60 — adopted January 1, 2025. No cash changed hands. No position was sold.
Under ASC 350-60, digital assets classified as held for investment are marked to fair value each quarter, with gains and losses flowing directly to the income statement. Coinbase held BTC (approx. $B at year-end /BTC) and ETH (approx. $M) at year-end 2025. Every move in those assets produces a approx. $M GAAP income impact with zero connection to the operating business. GAAP EPS for Coinbase is now structurally a hybrid: part operating earnings, part crypto mark-to-market.
Adjusted EPS of $ is the economically meaningful number. Adjusted EBITDA of $M at a margin is the operating story. Any screen or model filtering by GAAP earnings will systematically misread every quarterly result for as long as Coinbase holds a material crypto portfolio.
Key implication: Use Adjusted metrics exclusively. GAAP headlines will continue to distort in both directions every quarter.
Developer Platform & Institutional Infrastructure — The Business with No Revenue Line
Enterprise Clients: 270+ | Government Clients: 150+ | “Other Transaction” + “Other Sub & Services”: $807.7M combined
JPMorgan. Citi. BlackRock. Stripe. PayPal. Revolut. Shopify. Plus government agencies. Brian Armstrong has used the AWS analogy explicitly — an infrastructure layer that financial services companies plug into. FY2025 platform metrics suggest the thesis is already materializing: $T in trading volume ( YoY), M monthly transacting users, $B in assets on platform.
The problem for investors is that none of the developer platform revenue has its own line. CDP economics are embedded across “Other Transaction” ($M, YoY) and “Other Sub & Services” ($M, YoY) — two catch-all segments with no sub-breakout in any public filing. The models I’ve come across have no dedicated sub-model for either. At institutional custody fee rates of -bps on $B in platform assets, implied custody revenue alone is $M-$M annually — a range that substantially overlaps the combined catch-all lines. This is deliberately opaque for competitive reasons.
AWS was also buried inside Amazon’s consolidated North America revenue for years before the disclosure that repriced the entire company. That precedent is the relevant analogy — and that disclosure event, when it comes for Coinbase, will be a revaluation catalyst.
Key catalyst: Separate CDP revenue disclosure. Watch for client-side disclosures from Citi, JPMorgan, BlackRock on digital asset infrastructure spending.
Coinbase One — Building a Subscriber Base and Cannibalizing Transaction Revenue Simultaneously
Subscribers: approx. 971K (ATH, 3x in 3 years) | Estimated Annual Subscription Revenue: $60-350M | Estimated Fee Revenue Foregone: approx. $81M/year
Coinbase One reached approx. K subscribers by end of 2025 — all-time high, x growth in three years. The product offers zero-commission trading, enhanced support, and staking rate boosts at $/month base. Revenue is inside “Other Sub & Services” with no public breakout. Estimated annual subscription revenue: $-M depending on tier mix. The range is wide because the premium tier pricing is undisclosed.
The more important number is what Coinbase One costs. At approx. K subscribers trading approx. $/month and a bps blended take rate, the annual transaction fee revenue Coinbase does not collect is approximately $M. That sum grows with the subscriber base. The net P&L effect is positive only if subscriber lifetime value — lower churn, higher on-platform balances, incremental staking, deeper engagement — exceeds the cumulative fee sacrifice. Coinbase has not disclosed the data needed to verify that calculation externally.
Most model coverage I’ve seen applies a approx. growth rate to the full Other Sub & Services aggregation as a placeholder. That approach can’t capture whether subscription growth is accelerating relative to cannibalization, or whether the flywheel retention effects are materializing. The disclosure that would close this gap: separate Coinbase One subscriber count, average revenue per subscriber, and churn rate. Until then, the net P&L analysis above is the best available external approximation.
Key catalyst: Coinbase One revenue disclosed as standalone line (as previously done with custodial fees) — that disclosure reprices the recurring revenue multiple.
The Financial Model
My financial model is the analytical foundation for every financial claim above. Built on Bloomberg Terminal standardized data for FY2019A-FY2025A, it extends through FY2030E across a full three-statement architecture.
The model contains ten tabs:
-
The
Income Statementcovers FY2019A through FY2030E with analyst-added sub-rows for Base chain sequencer revenue inside Other Transaction, Deribit contribution inside Institutional Revenue, and Coinbase One ARR inside Other Subscription & Services. All historical line items are reconciled to Bloomberg standardized data. -
The
Balance SheetandCash Flow Statementcomplete the three-statement model, with cash computed as a roll-forward from CFS operating, investing, and financing activities. -
The
DCF Modelcontains a full CAPM-based WACC build (Blume-adjusted beta = 2.80x, WACC = 14.3%), FCFF projections through FY2030E, terminal value via both Gordon Growth (g = 6%) and Exit EV/EBITDA Multiple (18x) methods, two 5x5 sensitivity tables, and a peer multiple calibration panel (CME, ICE, NDAQ, HOOD). -
The
Assumptionstab is the single source of truth for all driver inputs: macro/market assumptions (FFR path, ETH yield curve, BTC price), revenue line-item drivers (volumes, take rates, USDC balances, staking custody), OpEx margin assumptions, D&A schedules, balance sheet items, and cash flow assumptions. Every forecast cell in the three statements references this tab. -
The
USDC Scenariostab maps three revenue-sharing scenarios (Base: current 100%/50% terms, Bear: renegotiated 80%/40%, Stress: no off-platform share) across three Fed Funds rate paths (4.0%, 3.5%, 3.0%). Range of outcomes: $M to $M — a $M spread on a single revenue line. -
The
Deribit Acquisitiontab contains the acquisition summary, purchase price allocation, and annual amortization schedule FY2025A through FY2032E — including the $M annual GAAP drag beginning FY2026E. -
Supporting Schedulesconsolidate the Debt Schedule, PP&E Schedule, Share Count, Working Capital, and Tax Schedule into a single reference tab.
Key Risks
-
USDCcontract renewal: A renegotiation to 80%/40% sharing terms removes $-M from FY2026 revenue in a single event, depending on the rate path. This is the only risk in the model that is fully within a counterparty’s control rather than Coinbase’s. -
CME Group institutional competition: The May 29, 2026 24/7 crypto options launch introduces direct competition to Deribit’s institutional franchise. A 10-15% institutional flow shift to CME in H2 2026 implies $-M of revenue downside versus current estimates.
-
ETHstaking yield compression: 20-30bps of annual yield dilution as the validator set grows. RequiresETHprice appreciation to offset on a dollar-revenue basis. Bear case: compound compression plus flatETHprices. -
ASC 350-60 GAAP volatility: Crypto price moves will continue to produce large GAAP swings that bear no relation to operating performance. The risk is misinterpretation, not operational deterioration.